Hugo Bohórquez
Cloud Administrator | Infrastructure Specialist
Crafting secure, scalable, and modern cloud environments to empower businesses.
About Me
With over 15 years in enterprise infrastructure, I specialize in Azure cloud solutions, automation, and secure architecture. I’ve led cloud migrations, deployed robust monitoring systems, and collaborated globally to deliver scalable, high-performance environments. My focus is on optimizing infrastructure for reliability and efficiency, leveraging tools like Terraform, PowerShell, and Grafana.
Skills & Technologies
Cloud & Automation
Azure IaaS/PaaS, Terraform, PowerShell, Docker
Databases
Azure SQL, MSSQL, MySQL
Security & Monitoring
MFA, Defender, Log Analytics, Prometheus, Grafana
Highlighted Projects
Azure Web App with Backend DB
Provisioned a multi-tier application using Terraform, Azure App Services, Azure SQL, and VNet integration. Implemented secure deployment practices, ensuring scalability and high availability.
Utilized Azure Resource Manager (ARM) templates for infrastructure-as-code, integrated Azure Monitor for real-time performance tracking, and ensured compliance with ISO 27001 standards.

Diagram
User Access with MFA
Managed Entra ID for secure access, implementing dynamic security groups and Conditional Access MFA policies to enhance application security.
Configured Azure AD Connect for hybrid identity synchronization, reduced unauthorized access by 95%, and automated user provisioning with PowerShell scripts.

Dashboard
Observability Dashboard
Developed a cost-free observability platform using Prometheus, Grafana, and Node Exporter to monitor a Linux server (IP: 192.168.50.99) for CPU, memory, disk, and network metrics. Automated deployment with Docker and visualized data via Grafana’s Node Exporter Full dashboard (ID: 1860). Showcases expertise in cloud-native monitoring, metrics collection, and automation.
Impact: Enables real-time infrastructure insights, reducing downtime and optimizing performance for homelab and enterprise environments.
Designed a Docker Compose setup for multi-container deployment, integrated Prometheus with Node Exporter for metrics scraping, and customized Grafana dashboards for actionable insights.
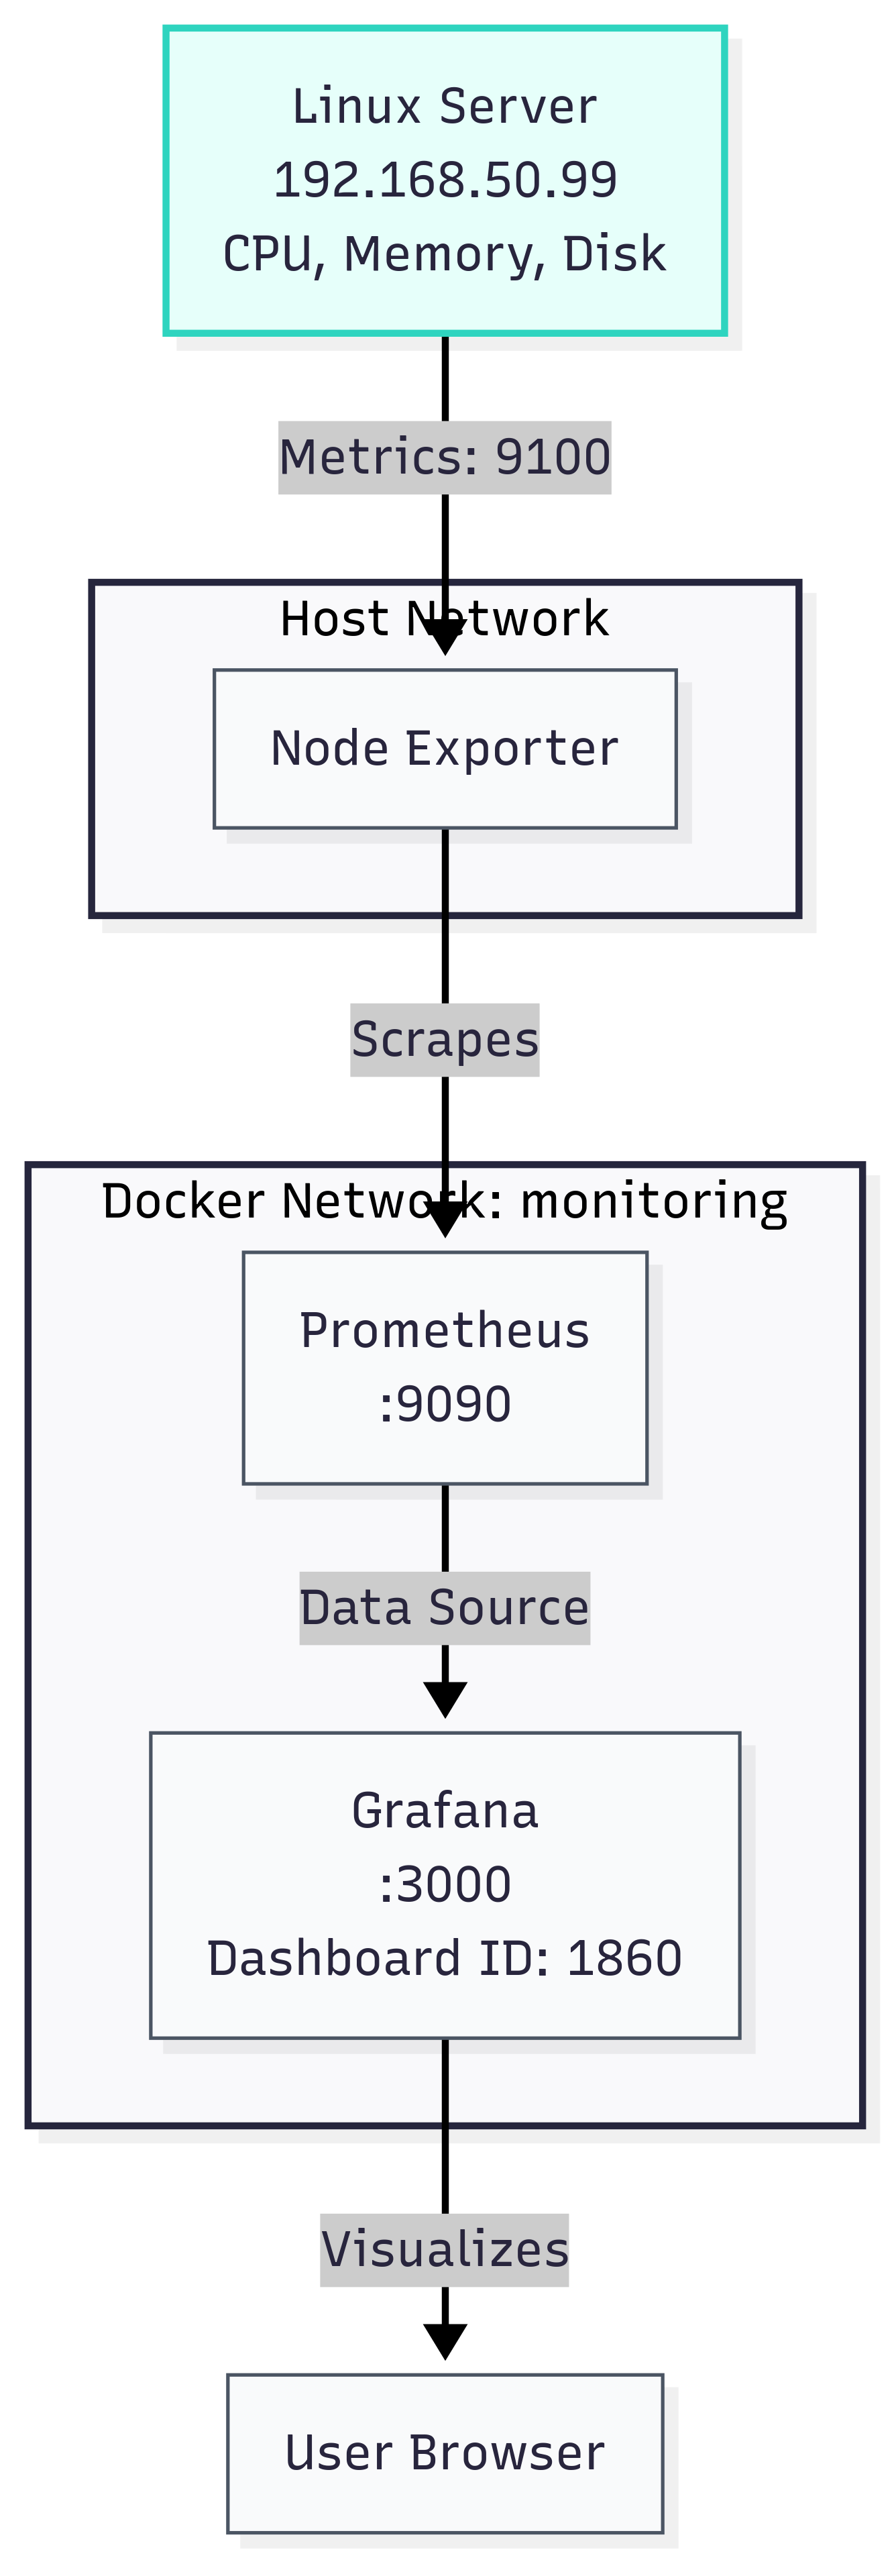
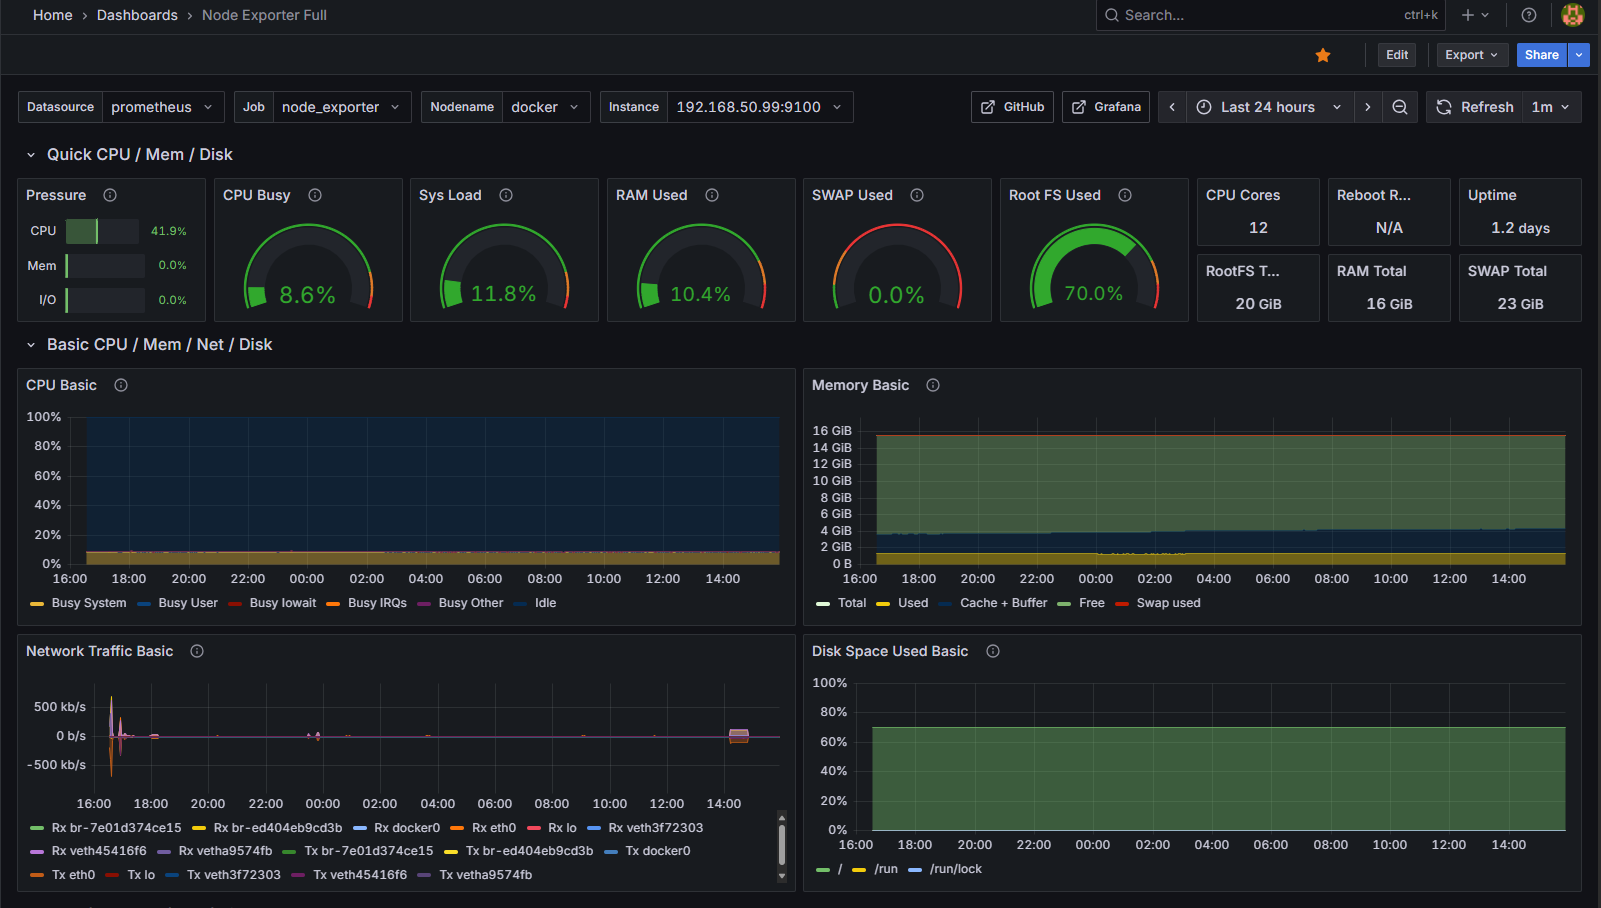
Diagram / Dashboard
Let’s Connect
Interested in discussing cloud solutions or opportunities? Reach out via the form below.